VandM.com
E-Commerce Story Mapping and User Flows


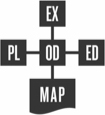
Story and Feature Mapping
When beginning the process for uncovering requirements for a new application, I frequently use a workshopping method that is a hybrid of the Story Mapping technique famously advocated by Jeff Patton.
The technique allows team members to collaboratively provide input into the feature set and provides opportunity to raise red flags and spot opportunities early.
It's also extremely useful for providing visibility to stakeholders into the complexity, scope and impact of decisions in real time, allowing them to plan early for internal business impacts.
The output of this process is a living feature document that can be prioritized and input into any number of development processes and acts as the canonical source of what needs to be built.

Process Flow Documentation
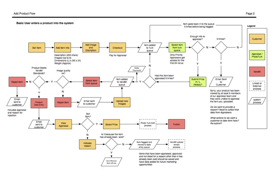
Once the features set is sufficiently mapped they can be layered on to a process flow to illustrate logic and business rules. In this example I am illustrating how a "seller" user-type inputs a product into an e-commerce system and the approval flow it needs to go through in order to get published on to the live site.

Allegiant Air
Airline Maintenance Operations Application
AOS Work Control Screen
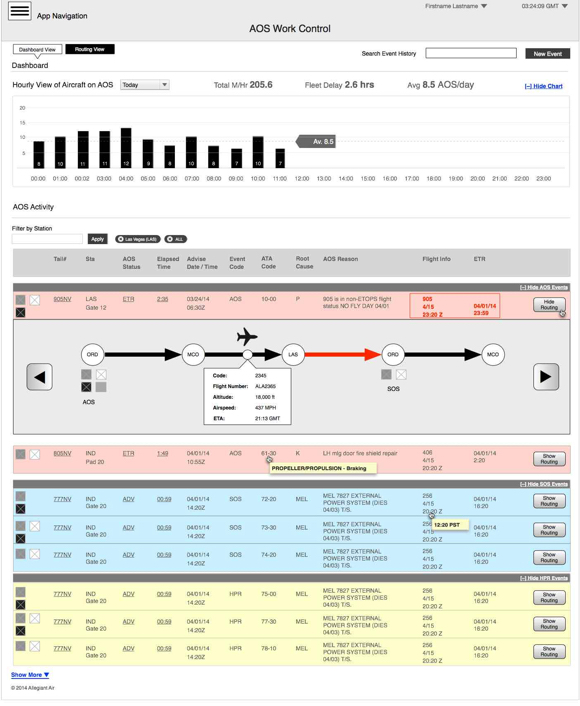
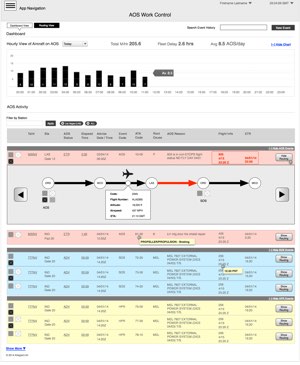
This screen allows maintenance crew and ground operations to see all aircraft in the fleet that are out of service due to maintenance issues.
Charts display the hourly performance of the maintenance crew. Colored Bands express the urgency of required repairs relative to the next scheduled departure for the aircraft. As impending departure times approach, warning signals are displayed to let terminal operations know if they need to arrange for cancellation, delays or replacement aircraft.
The screen provides both a system-wide view that allows management to evaluate the efficacy and status of the entire fleet as well as filtered views that allow local maintenance crews to see only the aircraft that they need to work on.
Scheduled Engine Service
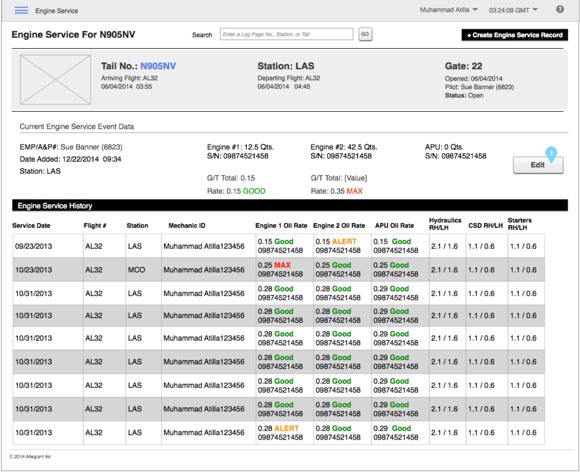
In addition to unexpected repairs, aircraft and aircraft parts require scheduled maintenance based on FAA regulations. Maintenance schedules are administered by a separate application (also designed by me as part of this project) based on a variety of variables such as, flight hours, cycles and milage.
This page illustrates a service ticket for replacing engine oil on a specific aircraft. The ticket includes the location, and schedule of the aircraft as well as its full oil service history. From here, maintenance crew know what action needs to be taken on the tail and the system enables them to create a record indicating that the maintenance order has been fulfilled.

local.com
Mobile Application Design
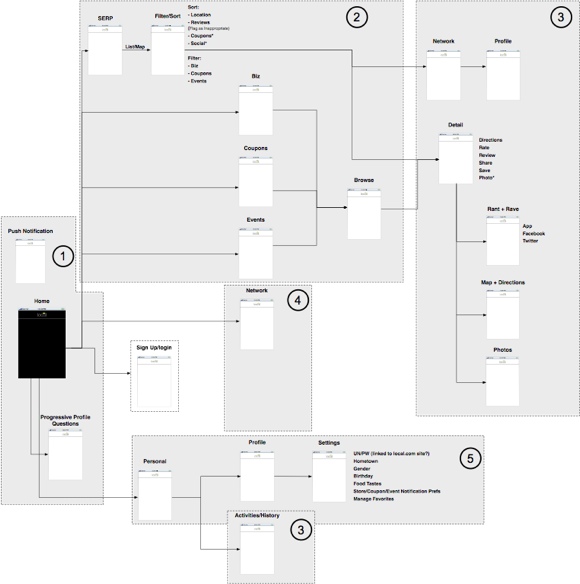
Diagram of User Modalities
As an integral part of the application mapping process, I organized screens into categories that correlated to a user’s behavioral mode of use.
For example, screens in group 3 are about "Active User Engagement" because they are where users save coupons, rate and review businesses and share their experiences.
This is distinct from Group 2 activities which are focused on "Actively Searching" or Group 5 which is about "Managing Preferences."
User Interface Wireframes Modeled as a User Flow
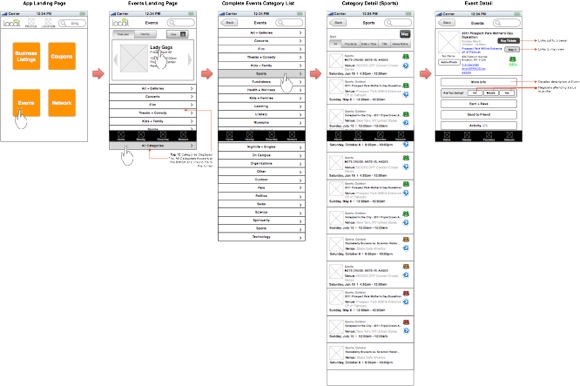
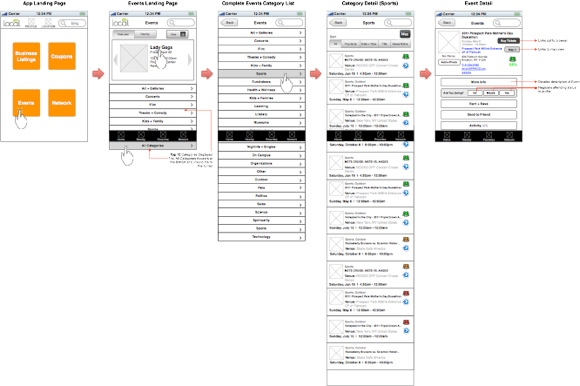
In order to better communicate the user's experience within a particular mode of use, I designed the screens in the context of user stories.
In this case a user is drilling down to events in his area and saving the event for future reference.
Chevron
Event Experience Modeling and Mobile Conference Application
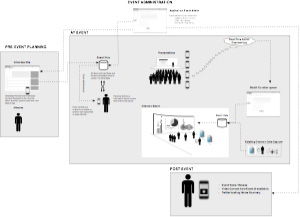
Experience Model for Chevron’s at World Petroleum Congress 2011
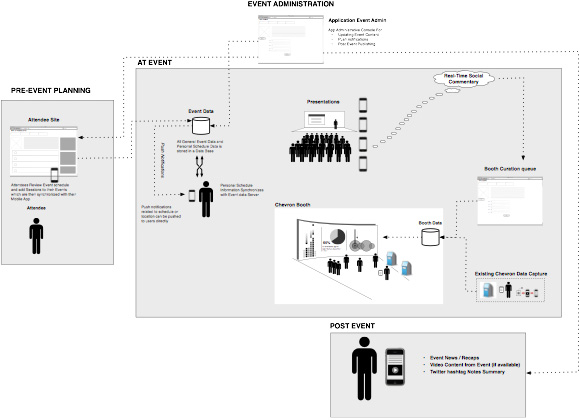
The above diagram is a visualization of the experience of event attendees and event data intermingle in a variety of contexts and points in time during the World Petroleum Congress in Doha 2011.
Data was captured in real time using Print/QR Codes, Kiosks, Tweets from Conference sessions, and roaming surveyors with iPads. The data was then stored and curated centrally and displayed on a video wall in Chevron’s booth.
Summary date, video, blogs and other content was then aggregated and shared post-conference via the sponsored mobile conference app.
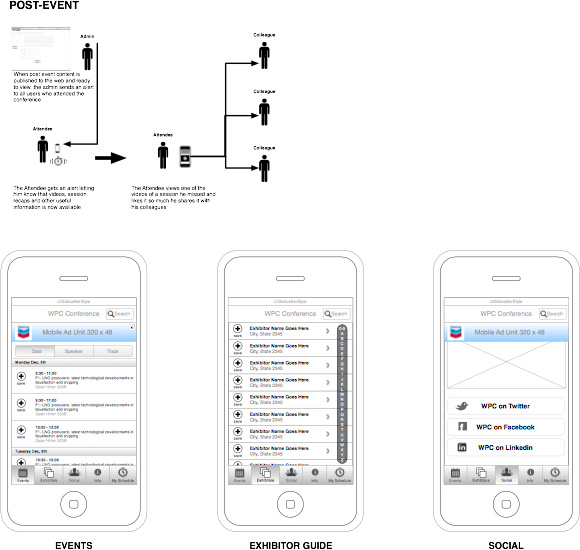
Mobile Conference App
These are three screens designed for the mobile conference application sponsored by Chevron at WPC 2011. Among other things, the application allowed users to create their own schedules, share their experiences and view curated editorial and view content related to the event.

CAVE Language
IOT/VR Application Modeling Language cavelanguage.org
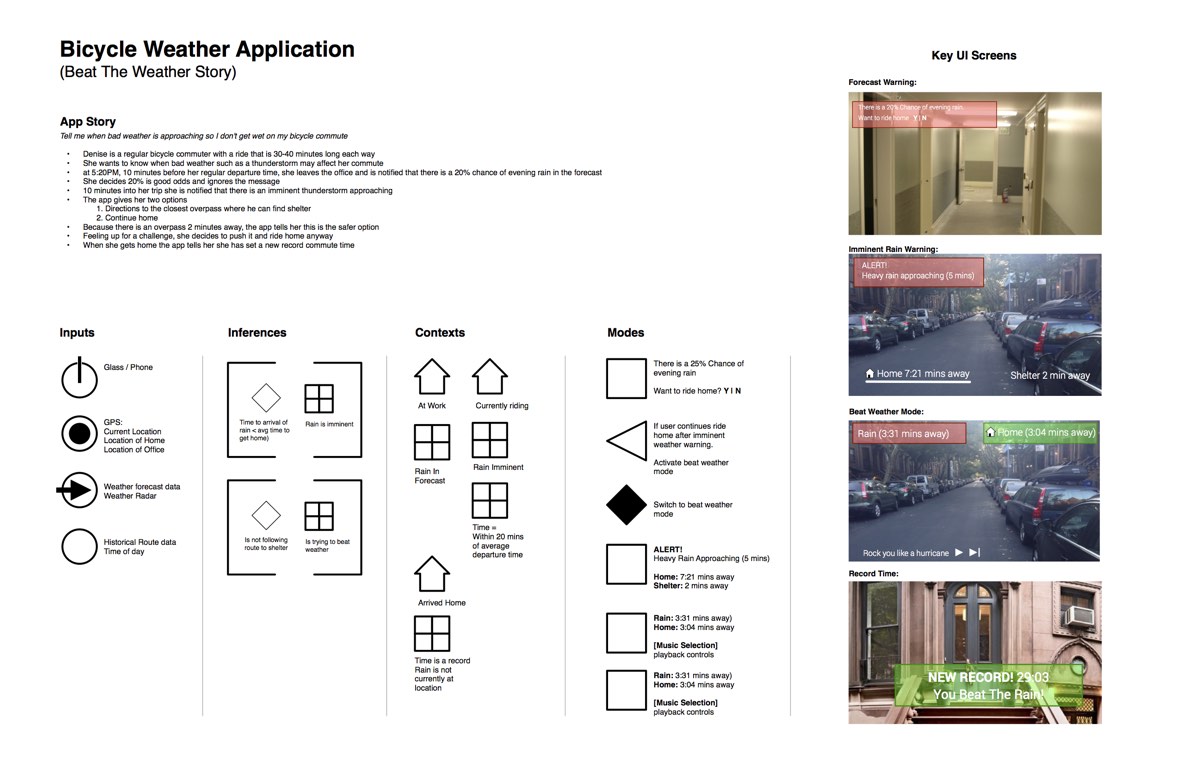
Conversational Architecture Visual Expression
CAVE Language is a whiteboard, napkin and presentation-friendly visual design language for describing the behaviors of contextual applications for IOT devices and device systems.
Contextual Applications react to the context of the user - their specific circumstances - and dynamically respond according to that context.
I worked with my colleague Loren Davie to create a symbol library and examples of practical applications. The full library can be found at: cavelanguage.org
AR Glass Prototype Journey
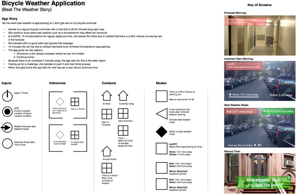
The above illustrates a cycling application that warns users of impending rain and the likelihood of encountering it on a daily commute.
The app is aware of the user's cycling history, pulls from varied data sources and triggers "modes" based on Inferences and Contexts that in turn display content in the user's Google Glass HUD

Betterrecipes.com
Social Recipe Site
Home Page
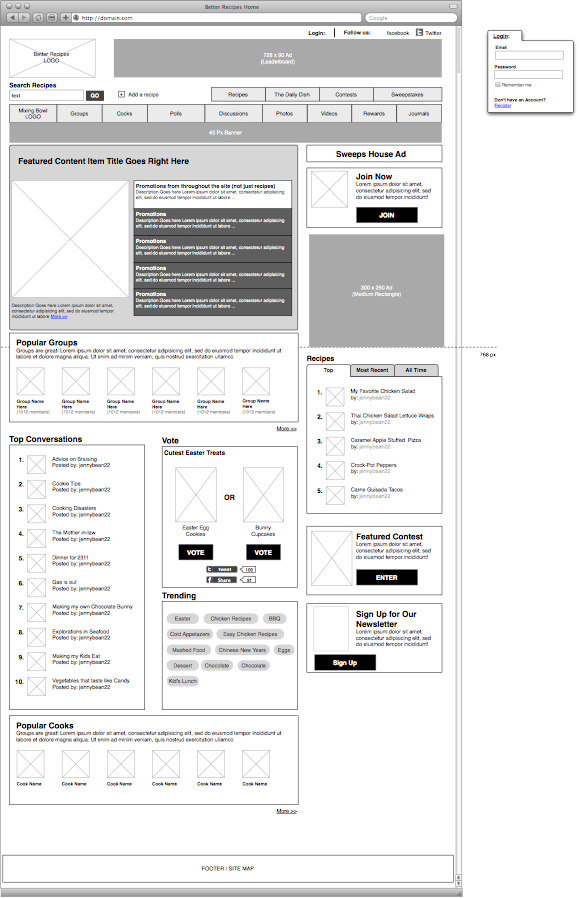
The Homepage for the site integrates elements from the content-oriented side of the business as well as a host of social, sharing and 2.0 capabilities that were adapted from concepts that existed on Mixingbowl.com, the publication’s sister property.
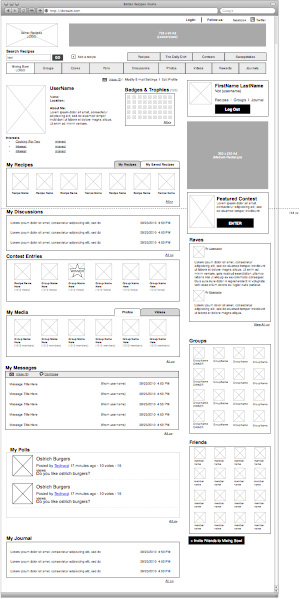
User Detail Page
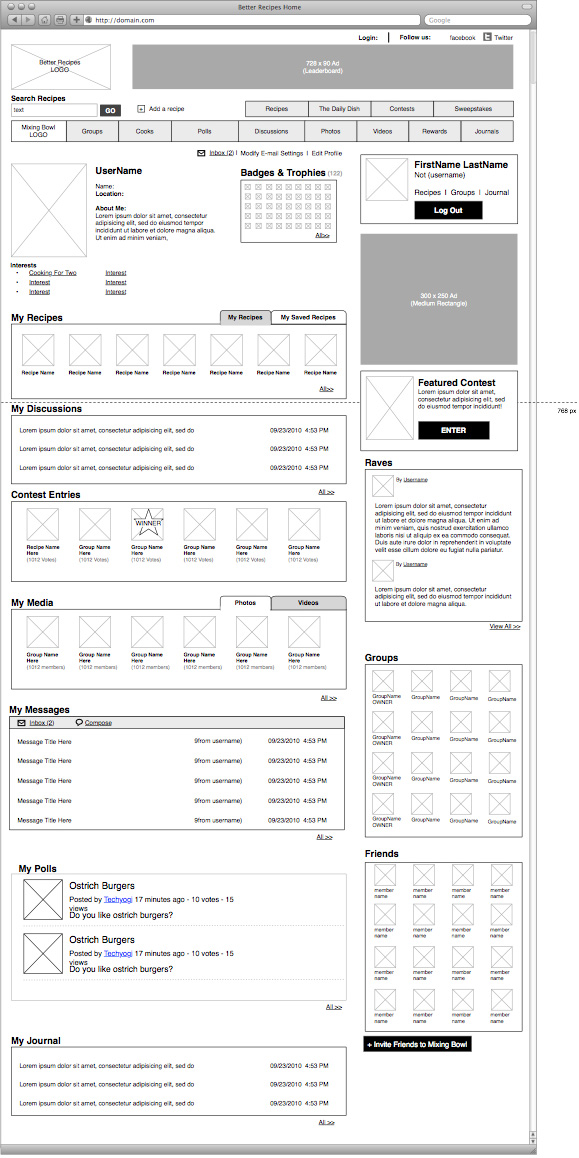
This page provides an overview of a user’s activity, groups, friends, favorite recipes, discussion forums, an inbox for messages, polls the user has participated in etc.
Everything was designed to be modular so that the site experience can easily be re-prioritized based on analytics and user feedback.

traveler.com
Country & City Detail Pages (sketch-style)
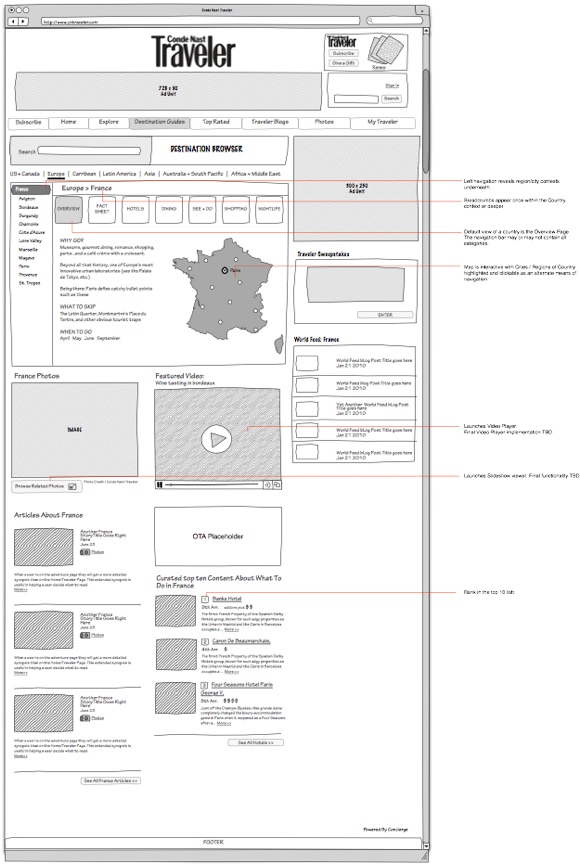
Country Detail Page
This is the landing page for a country in the Traveler site. The content provides overview information about the country’s major cities and attractions as well as slideshows, video content and links to past articles published in Conde Nast Traveler magazine.
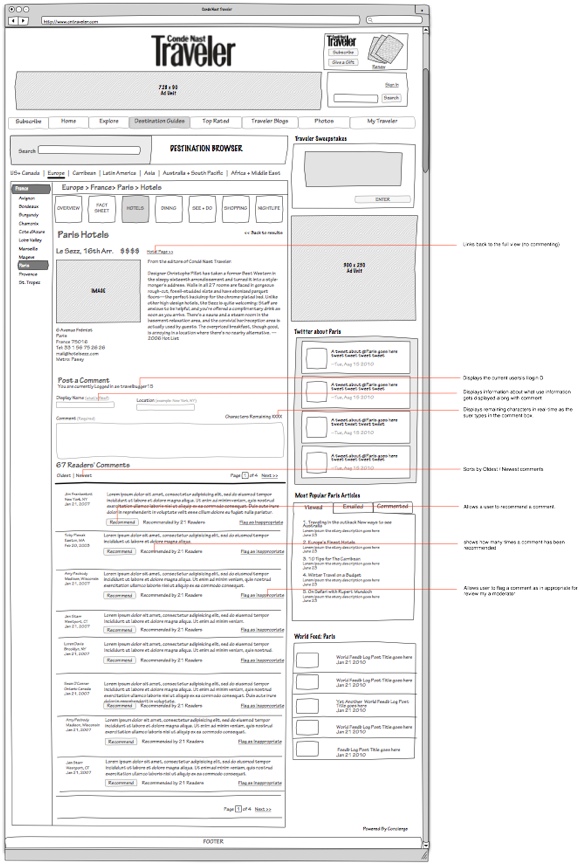
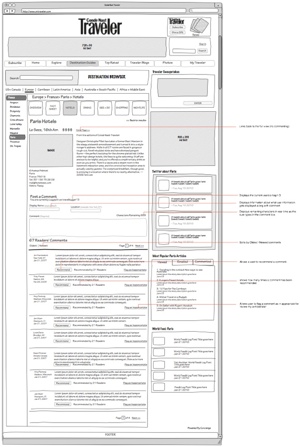
Hotel Detail Page with User Generated Content
The hotel detail page displays Traveler ratings, price information contact information, Images and user reviews. Content Modules in the right rail of this layout cross pollenates similar but related content within the site.

Hearst Corporation
LMK.com Website Architecture
Home Page and Entity Pages
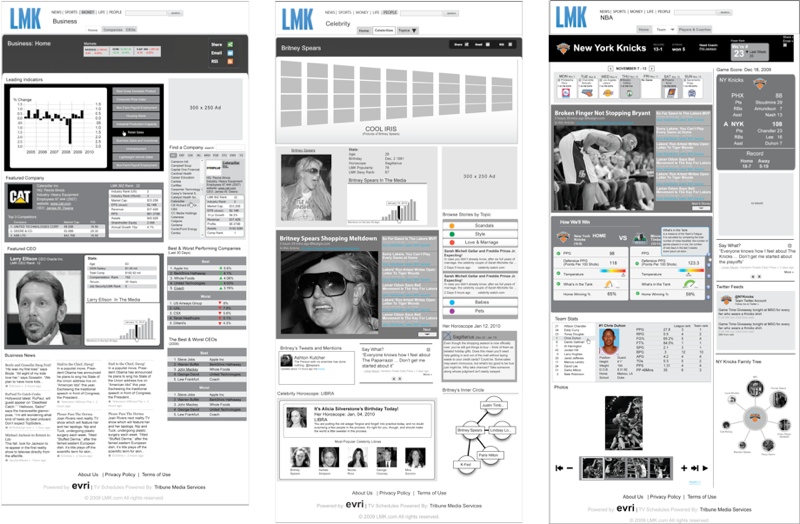
LMK.com is a family of topic-based websites driven from a variety of dynamic data sources. Topic sites included:
- Celebrity
- NBA
- College Football
- Detailed information about individual works
- Audio Tours Page
Module-Based Content Feeds
All of the sites are module based, managed in Joomla. The modules are driven from disparate data sources which were re-combined and displayed with innovative data visualization design concepts.
These three pages constitute a Home Page (for Business), and two “Entity Pages.” one for a person (Britney Spears) and one for a Team (NY Knicks)

Hyundai
Park your Elantra in the Driveway Campaign
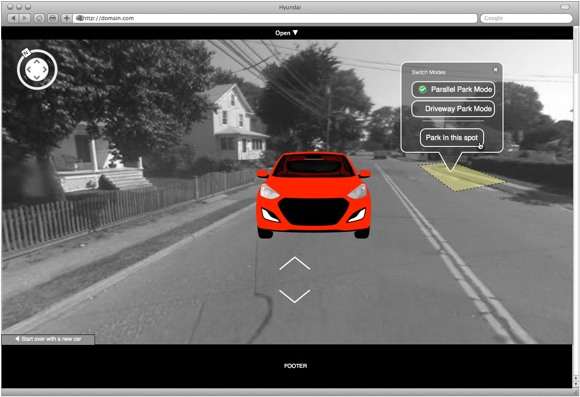
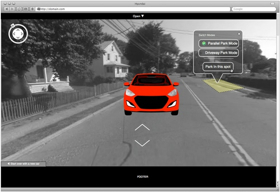
3D object manipulation UI in Google maps
Standard 3D object manipulation tools proved too abstract and cumbersome. As an alternative, we utilized the polygon tool built into the Google maps API that allowed the user to easily guide the car into place.
Once in place the used is able to select parallel parking or perpendicular (driveway) parking.
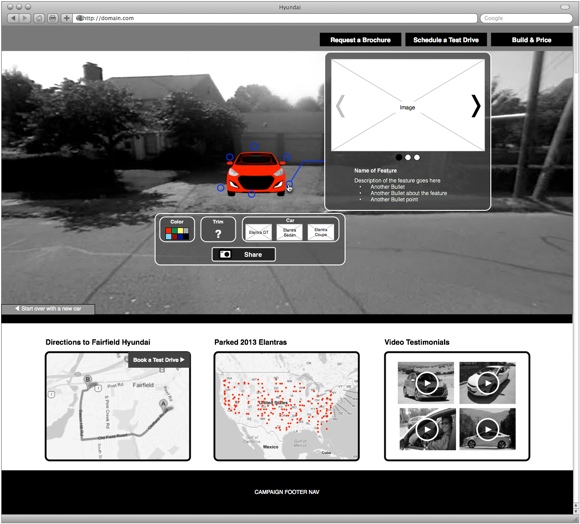
Customizing a Parked Car
Once the car is parked and in position, hot spots appear to illustrate Elantra features along with tools to change the color and trim of the car.
When complete the user is able to compile a movie showing the car driving from the dealer to her driveway that could be shared via a variety of social media networks

Pampers
Mobile Parenting Application Portal
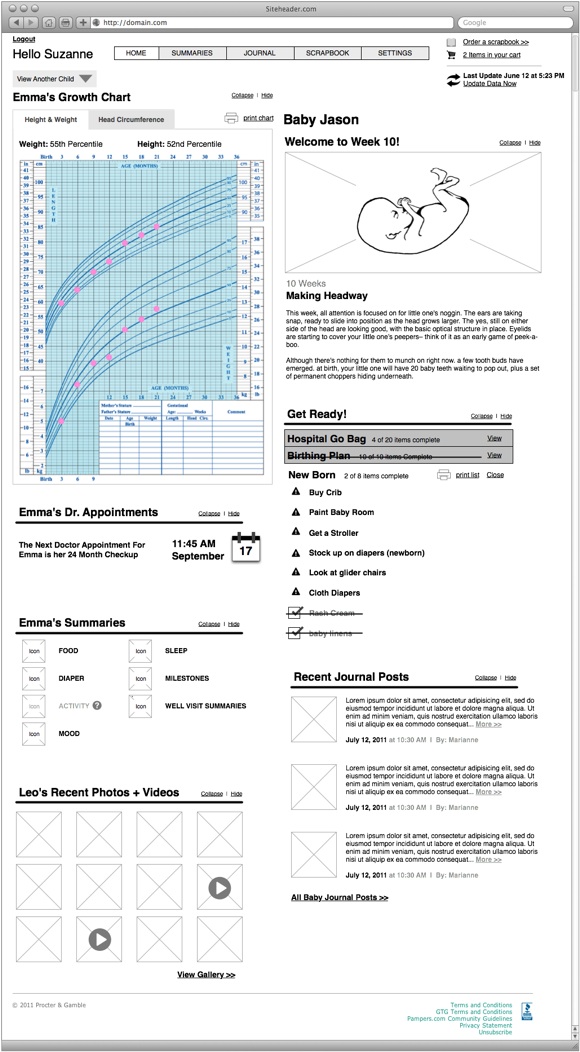
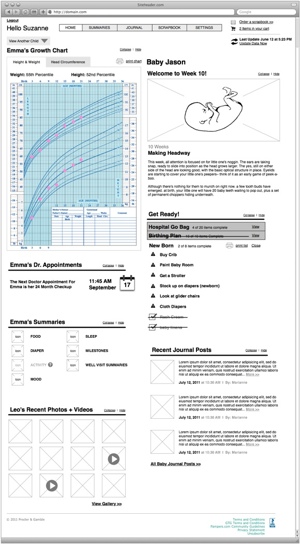
Portal Landing page
The content on the portal is driven by three separate mobile apps that can be used independently or in any combination. This view represents the state of the home page where a user is actively utilizing all Apps.
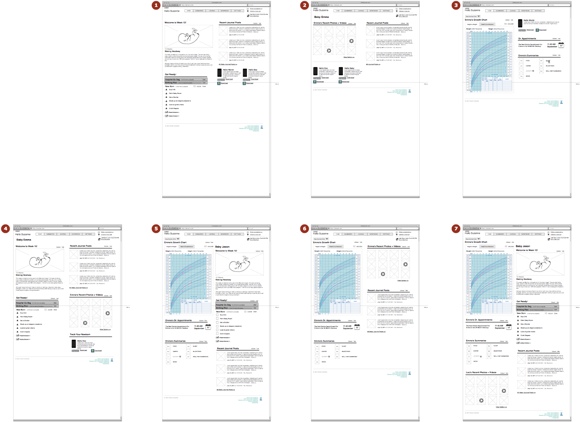
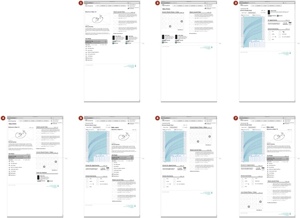
Specification for portal display, dependent on number of installed mobile apps
Integral to the specification process was identifying the states of the portal in all potential combinations of available mobile applications.The above represents the seven potential display combinations.

ReInsider
Commercial Real Estate Activity Site
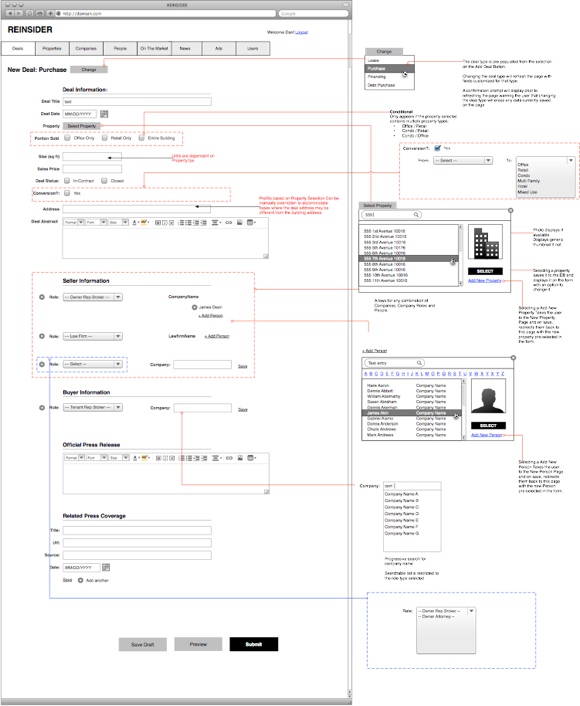
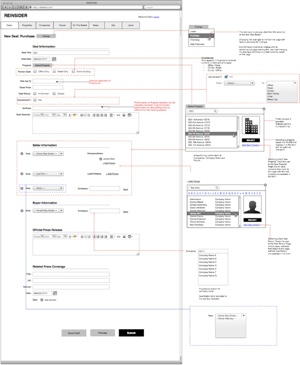
Structured deal data from CMS Back-end
To get deal-related data from unstructured data sources and into a structured content delivery system, I designed a fully featured Content Management System including tools to publish articles, serve ads and manage all data relevant to deal-types, buildings, companies, and people involved in a commercial real-estate deal.
Portal Landing page
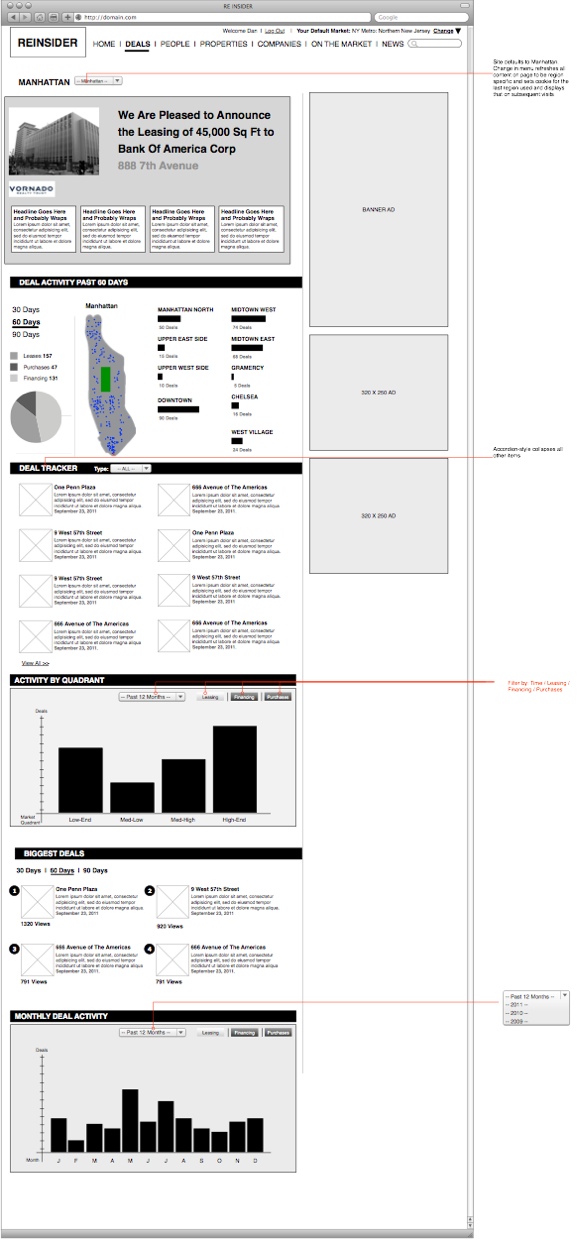
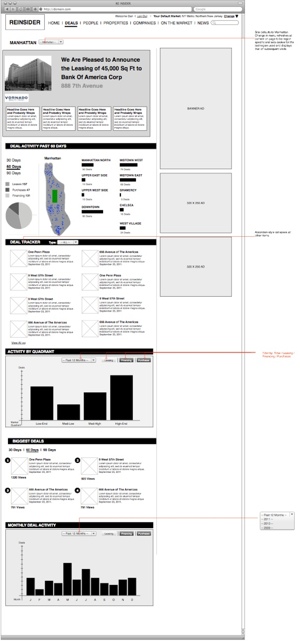
This page displays commercial real estate activity associated with a specific region.
Data is parsed from a custom designed CMS back-end (right) and aggregated in to quantitative displays of graphical data.

Goldenliving CMS
Template Selector and WYSIWYG Editor
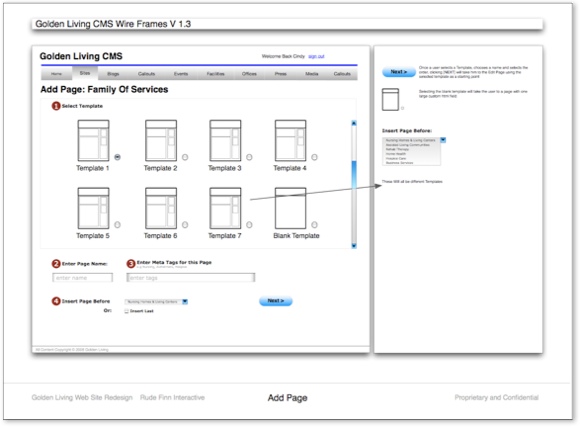
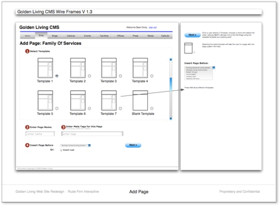
Template Selector
The CMS was designed with seven pre-formatted html templates, populated with sample content and images, as well as a blank html template to allow for a completely custom page.
This screen illustrates the step in the new page creation process where the user selects the desired template, names the page, enters meta tags and selects its place in the site hierarchy.
WYSIWYG Editor and Workflow
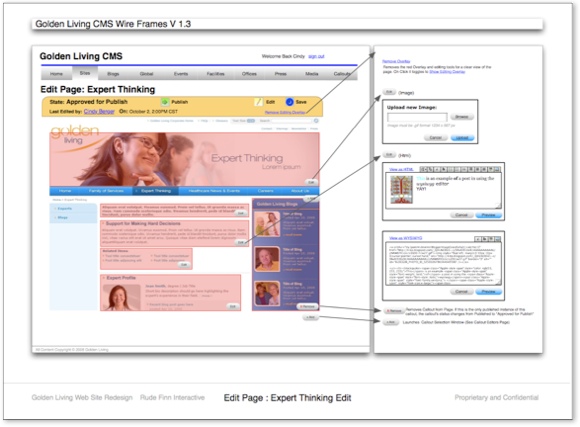
To facilitate ease of use, every page containing unstructured data was divided into sections and made editable via an in-line html editor. Each section is represented by a transparent overlay and can be edited independently of the other content on the page.
Callouts (on the right side of the page) contain promotional content that is centrally managed for ease of re-use.
The Yellow bar at the top of the page contains information about the state of this page in the CMS workflow. All of the tools necessary to move it forwards or backwards in the flow are visible, in addition to key information such as when this page was last edited and by whom.

Merrill Lynch
Managed Solutions Financial Advisor Portal
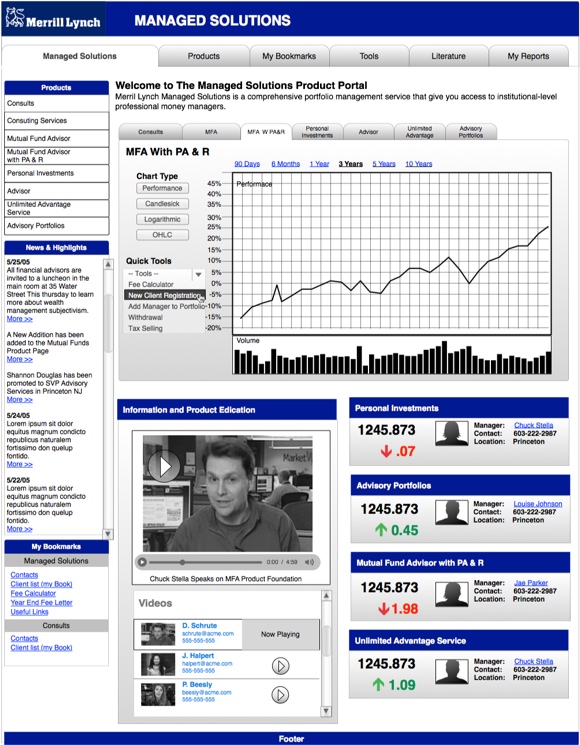
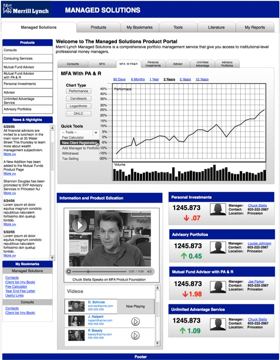
Managed Solutions Landing Page
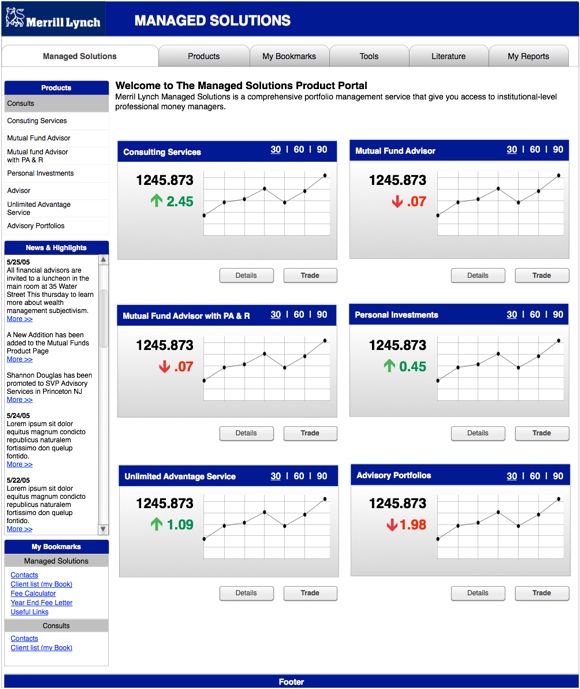
The Landing Page for the Managed Solutions product line provides access to charting for all product families in a tabbed navigation as well as “quick jump” tools for each product.
The site provides persistent access to relevant news and a personalized bookmarking tool for FA’s to store links to their most frequently accessed funds.
Intra-day performance and contact information for the fund managers listed on the right.
Consults Product Page
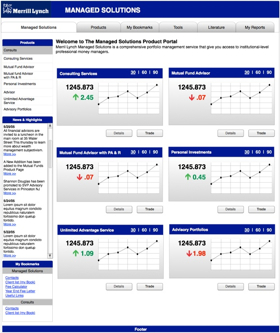
Product Group Pages allow users to do detailed research and comparisons on the funds within a product line. The center module contains a table of products, managers, and access to filtering and charting tools.
Critical news, alerts and product updates are listed at the top of the page and links to all product related tools are listed according to different types of FA activity.
Owens Illinois
Glass Is Life Campaign Experience Design
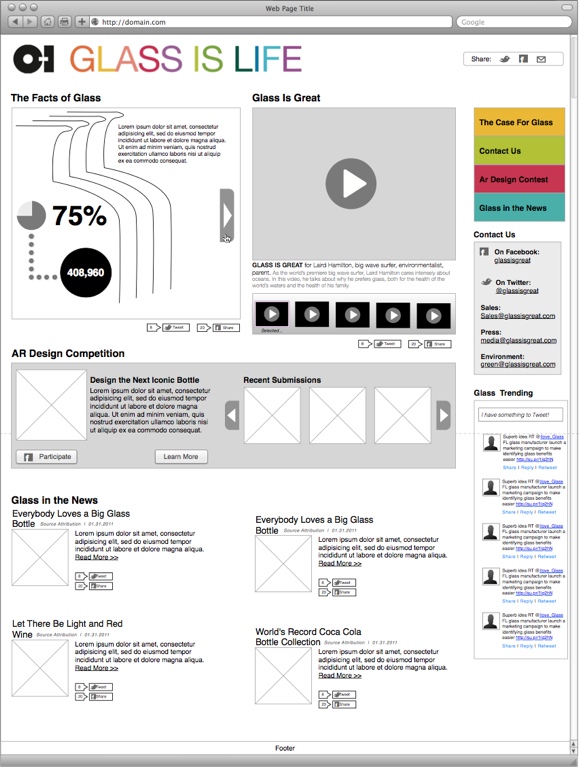
Home Page
The campaign landing page was designed to highlight the features, benefits and technology advances specific to Owens Illinois and their glass product innovations. Information graphics, video and innovation is highlighted but the focus is on encouraging industrial design students to submit glass bottle designs with the promise that one design will be used in an actual product for a major brand.
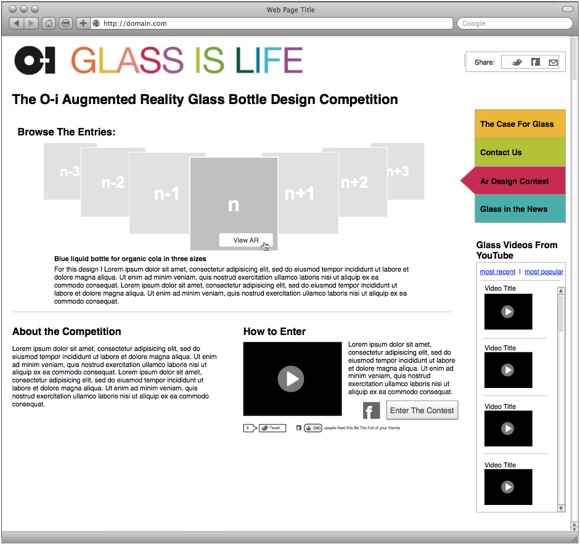
Augmented Reality Contest / Gallery Page
As part of the campaign, Owens Illinois solicited design entries from students industrial design programs and design enthusiasts around the Internet. Users were encouraged to enter designs for new bottle shapes, the winner of which would be manufactured and produced for a major beverage brand.
Lays Brand Potato Chips
Social Brand Experience Site With Flickr Integration
Assigning Photos to an Image Pool Flow
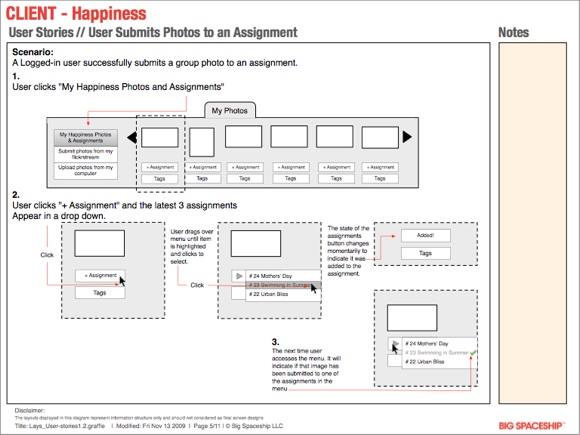
This page a user story illustrating how a user adds an image from his/her Group Flickr stream to one of the open Happiness Assignments available in the control dock.
Each dotted block is a zoom in on a particular aspect of the dock user experience.
Front-end UI changes are called out visually and with explanation as to how they relate to the user’s image status in the database.
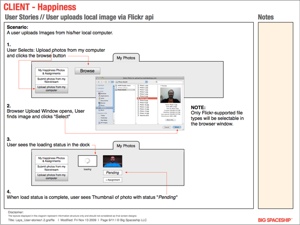
Uploading Photos Flow
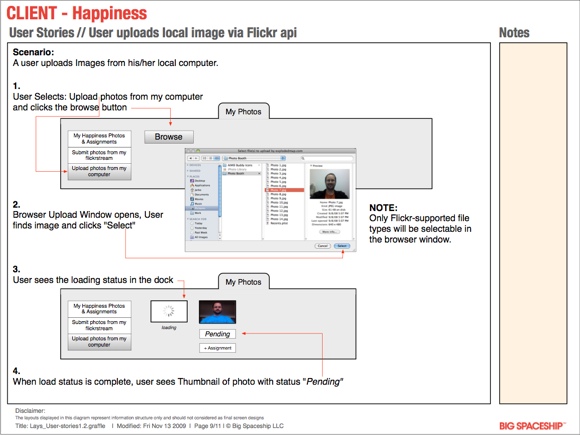
Users can upload images directly from their local machine to the Flickr group if they do not have images suitable for the happiness site already within their Flickr account.
This user story illustrates the process for adding photos to the Flickr group via the site one at a time along with upload status and visual cues that let the user know the status of their upload in the moderation queue.

Metropolitan Museum of Art
Interactive Mobile Prototype
Screens From Prototype
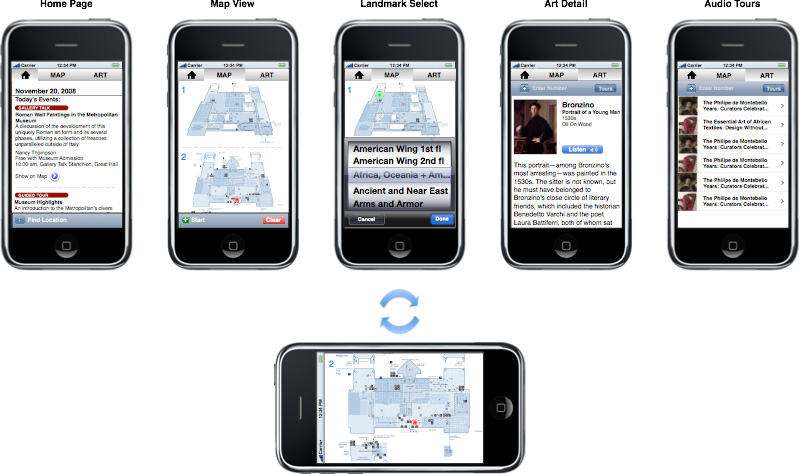
Above is a selection of screens taken from a proof of concept project I executed for the Metropolitan Museum of Art. Screens Included:
- Home page with timely updated events at the Museum
- Interactive Floor plan map with wayfinding based on fixed landmarks
- Rotate View
- Detailed information about individual works
- Audio Tours Page
Interactive PDF
To help provide a better understanding of how the final application would operate, I scripted actions to every button and navigation element in Omnigraffle and exported the sample layouts as a pdf.
The result was a pdf file that was navigable as if it were a live application.
Marriott Hotels
Spring Hill Suites iAd Timed Experience Flows
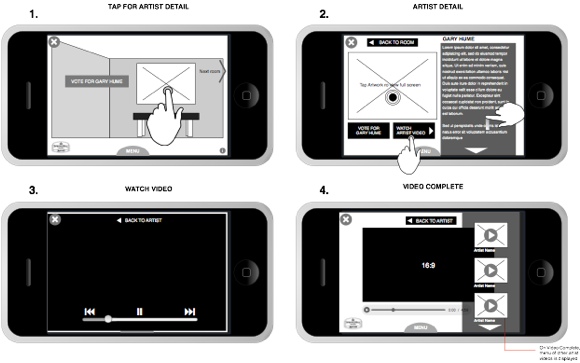
Screen Details for iAd Gestures Interactions
The iAd Campaign allowed users to view artwork from different artists in the context of a virtual Spring Hill Suites room. A User could then get more information about an artist including text and video content.
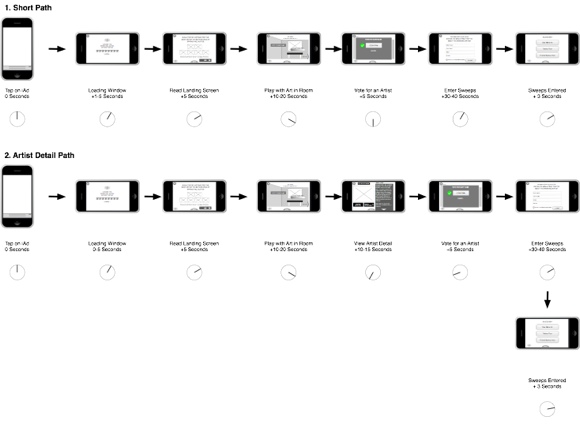

Time-based User Flows
As part of the experience map for the iAd, I included approximated time stamps to help model the anticipated time we could expect a user to stay engaged with the ad. Time stamps are indicated visually with a clock as well as in text form.

MySkin Inc.
Touchscreen in-Spa Skin Evaluation Interface
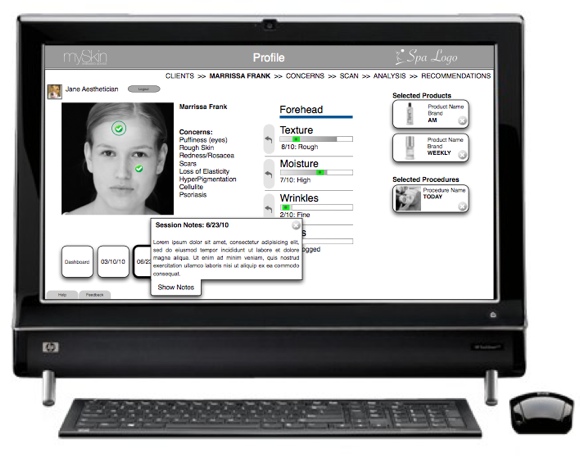
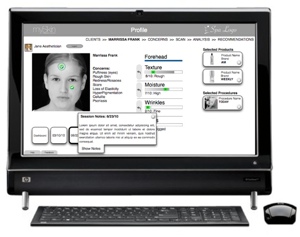
Patient Profile With Prior Scan Results Screen
The MySkin spa application relied on a hand-held scanner integrated with an HP TouchSmart display to be used in a therapeutic 1-on-1 setting.The above screen shows summary results from a previous session along with the data notes that were taken at the time.
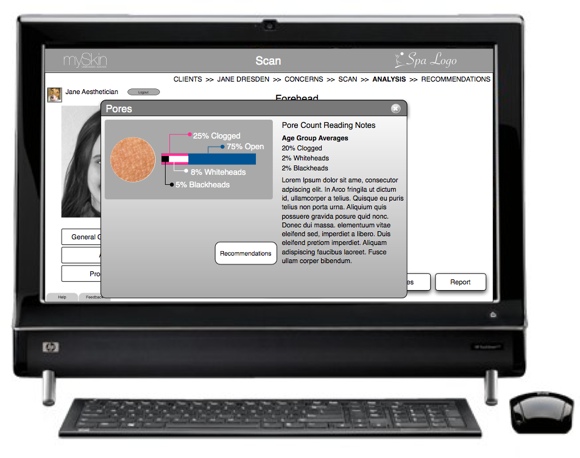
Scan Data Detail View
By tapping on an individual data point, the skin technician could pull out details of a specific reading. This provided opportunity to engage the patient in a conversation before making any specific skin care recommendations.
